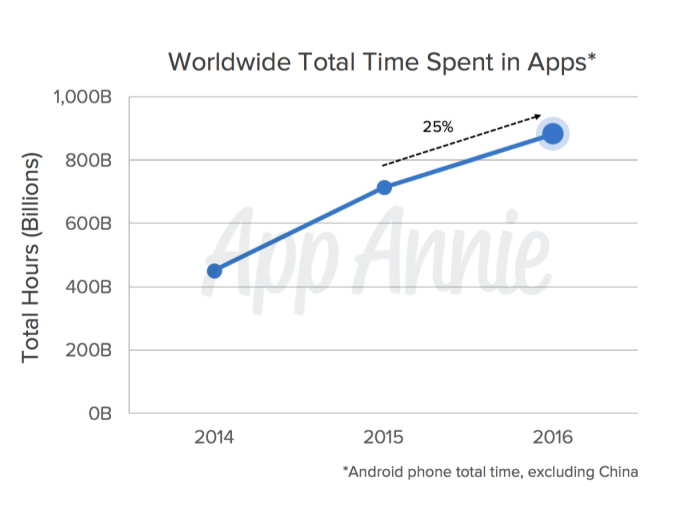

The app industry is continuing to grow, according to a new year-end analysis from app intelligence firm App Annie, out today, which found that app downloads, time spent in apps and revenue grew across the board over the course of 2016. Worldwide downloads were up 15 percent year-over-year, time spent in apps was up 25 percent, and the revenue paid to developers increased by 40 percent.
Downloads were roughly on the same path as last year, growing by 13 billion across the iOS App Store and Google Play to reach over 90 billion. Because of China, iOS downloads increased more this year than they did in 2015. In addition, non-game apps contributed to more download growth than games, in particular in categories like Finance, Travel, Photo & Video on iOS and Productivity, Tools, and Social on Google Play.

Of course, downloads don’t tell the whole story, which is why App Annie examined the time spent using apps as well. It found that total time in apps was up by over 150 billion hours in 2016, reaching nearly 900 billion hours. However, this analysis was performed only on Android devices, excluding China, so it’s not the full picture.

It’s worth comparing this metric with that from another year-end report, released earlier this month from rival firm Sensor Tower. Its analysis also found that time spent in mobile apps was growing (it believed it to be much higher: 69 percent across iOS and Android), and it found that actual app usage – meaning sessions (aka app launches) – was only up by 11 percent. App Annie is defining usage as “time spent in apps,” which is technically a different metric.
In addition, Sensor Tower’s report found that sessions that grew in apps like messaging, social, sports, and business at the expense of others, including games.
Though the two reports come up with different figures, the same overall trends are apparent: users are spending more time in their apps, and games may not be a growth leader, on some fronts at least.

App Annie’s report also noted that users are launching a lot of apps per month in many markets – over 30, in fact, in places like the U.S., U.K., China, India, Japan Brazil and South Korea. This is roughly the same figure as in previous years. Nielsen had said in 2015 that people used around 26 or 27 apps per month. However, other analysts have noted before that only five non-native apps see heavy use monthly.
2016 was also a good year for App Store revenue growth, App Annie says. Publishers were paid over $35 billion across the iOS and Android app stores, or 40 percent growth – that’s more than 2015’s growth rate. When third-party Android stores were included in the analysis, revenue increased to almost $89 billion.
Again, China’s influence came into play here, contributing to nearly half of the iOS App Store’s annual growth. The country also passed all others to becoming the leading source of App Store revenue in 2016.
Most of China’s App Store revenue comes from games, and role-playing games were especially popular last year. Fantasy Westward Journey, for example, has earned over $800 million since its 2015 release. China also saw the largest revenue gains in social networking, with Tencent’s QQ messaging app contributing substantially.

Elsewhere in the world, games didn’t lose their edge when it comes to making developers money. The category generated 75 percent and 90 percent of revenue on the iOS App Store and Google Play, respectively. Of course, Pokémon Go’s impact cannot be overlooked here – the game reached $500 million in consumer spend in under 2 months’ time. By the end of 2016, it reached over $950 million in consumer spend – faster than some of the most successful games of all time, including Candy Crush, Puzzle & Dragons, and Clash of Clans.
The full report dives into other year-end trends, as well, including fintech apps’ popularity, the growth in video streaming (YouTube was number one in the U.S. and the U.K., but Netflix brought in more revenue), and increased use of shopping apps.
App Annie also noted that, based on downloads, Facebook earned 4 out of 5 of the top apps worldwide. The top 5 in order were Facebook, Messenger, WhatsApp, Instagram and Snapchat. This is a bit different from Nielsen’s list, which counted YouTube, Google Maps and Google Search in the top 5. By revenue, App Annie’s list was: Spotify, LINE, Netflix, Tinder and HBO Now.

